A Virtual $500,000 to Spend Online
But that's the easy part. After Virtually purchasing items students must successfully sort them into NEEDS and WANTS. Finally students use Microsoft Excel to create a spreadsheet of NEEDS and WANTS spending items and use formulas to calculate TOTAL SPENDING, Difference in SPENDING, MOST COSTLY ITEM, AVERAGE COST NEED AND WANT, and much more....
Information:
Target Outcome MSTE: Students will enter text into Office Suite software and use basic formulas and layout/organizational strategies.
Software: Microsoft Excel, Microsoft Powerpoint, Internet Browser
Added Skill Set: The use of Alt+Tab to switch between open programs, copy and paste techniques, textbox creation, and internet research.
Project Outline
Step 1: Begin by building a Powerpoint title slide with the title "NEEDS and WANTS" and subtitle YOUR NAME
Step 2: Create several new slides, Some for the NEEDS section and some for the WANTS section
Step 3: Open your internet browser and visit some of the trusted sites provided. To purchase something RIGHT CLICK ON IT AND COPY
Use Alt+Tab keys to switch back to powerpoint
Right Click and PASTE the item into the correct Powerpoint Section
(For the purpose of this project DO NOT CONCERN YOURSELF with buying Food, Throw away items, or smaller items such as light bulbs....keep the purchasing to large items only)
Step 4: Make sure you know the TRUE PRICE of the item you just purchased
In Powerpoint choose INSERT (at the top) then TEXTBOX
Click on the slide where you wish to enter the price
Type in the price
This box and the picture can be moved easily around the slide
Repeat Steps 3 and 4 until you have purchased 15 NEEDS and 15 WANTS minimum (your teacher may specify other amounts)
Step 5: Now that your Powerpoint is filled with correctly categorized purchases Open it up and also OPEN MICROSOFT OFFICE EXCEL (spreadsheets)
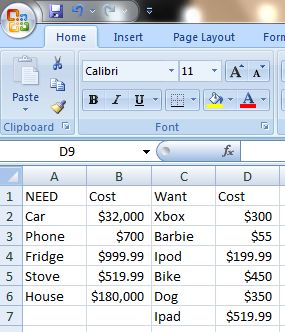
In Cell A1 type "NEED"
In Cell B1 type "Cost"
In Cell C1 type "Want"
In cell D1 type "Cost"
Fill in the name of the needs in Column A and their Price in Column B
Fill in the name of the wants in Column C and their price in Column D
EXAMPLE...
The Formulas
Now that all of your Powerpoint has successfully been entered into an Excel Budget Spreadsheet you can procede with the use of simple equations to tell you certain important information.
Highest Price Need and Want
In Cell E4 type "Expensive need" In E5 type "Expensive Want"
In Cell F4 use this equation " =max(highlight all needs prices) " hit enter to see result
In Cell F5 use this equation " =max(highlight all want prices) " hit enter to see result
Lowest Price Need and Want
In Cell E6 type "Cheap need" In E7 type "Cheap Want"
In Cell F6 use this equation " =min(highlight all needs prices) " hit enter to see result
In Cell F7 use this equation " =min(highlight all want prices) " hit enter to see result
Total Cost Needs and Wants
In Cell E8 type "Total Needs" and in E9 type "Total Wants"
In Cell F8 type " =sum(highlight all needs prices) " hit enter for total cost
In Cell F9 type " =sum(highlight all wants prices) " hit enter for total cost
Difference between NEEDS and WANTS Total Cost
In Cell E10 type "Cost Difference"
In F10 type " =F8-F9 " hit enter to see cost difference
Average Cost
In Cell E11 type "Average NEED" and in E12 type "Average Want"
In F11 type " =average(highlight all need prices) " hit enter
In F12 type " =average(highlight all want prices) " hit enter
You Should now save your spreadsheet as "YOURNAMEbudget" or something your teacher suggests
FINAL STEP:
Save both your powerpoint and spreadsheet and submit them to your teacher as directed.
Your name should be in the FILE TITLE for both files
Potential Shopping Linkswww.sears.ca
www.futureshop.ca www.propertyguys.ca www.bestbuy.ca www.autotrader.ca www.costco.ca www.leons.ca www.tigerdirect.ca www.toysrus.ca www.zellers.com |
Additional Material Teacher's Can Add1. Calculate taxes for all or individual expenses
2. Convert the cost to Australian or another country's currency using current exchange rate. use: www.XE.com 3. Determine the percent of the $500,000 that each item cost ex: house might be 38% etc.. |

